library(StoatPlot)
library(ggplot2)
library(dplyr)
#>
#> Attaching package: 'dplyr'
#> The following objects are masked from 'package:stats':
#>
#>     filter, lag
#> The following objects are masked from 'package:base':
#>
#>     intersect, setdiff, setequal, union
library(knitr)
Import association results
## path to association file (~stoat.assoc.pvalues.tsv.gz)
test_data_dir <- system.file('extdata', package='StoatPlot')
assoc_file = file.path(test_data_dir, 'stoat.quantitative.assoc.pvalues.tsv.gz')

## import association results
assoc = import_assoc(assoc_file)
Summary
| Total variants |
680 |
| Variant PV<0.01 |
31 |
| Variant adjusted PV<0.01 |
2 |
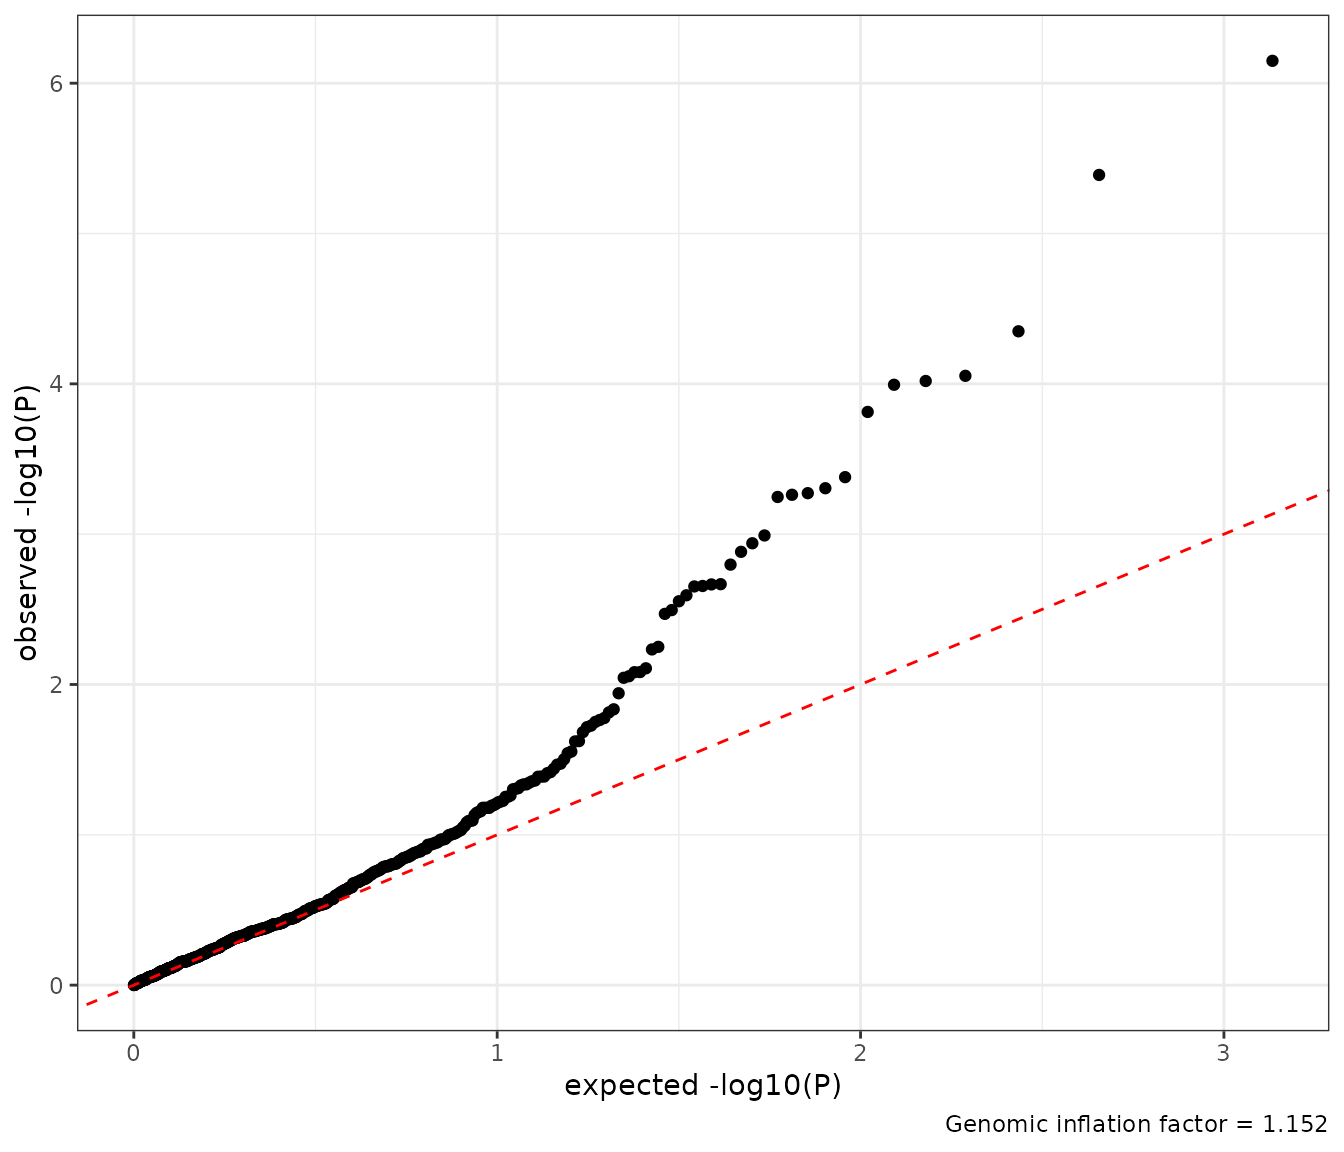
| Genomic inflation factor |
1.15 |
QQ-plot
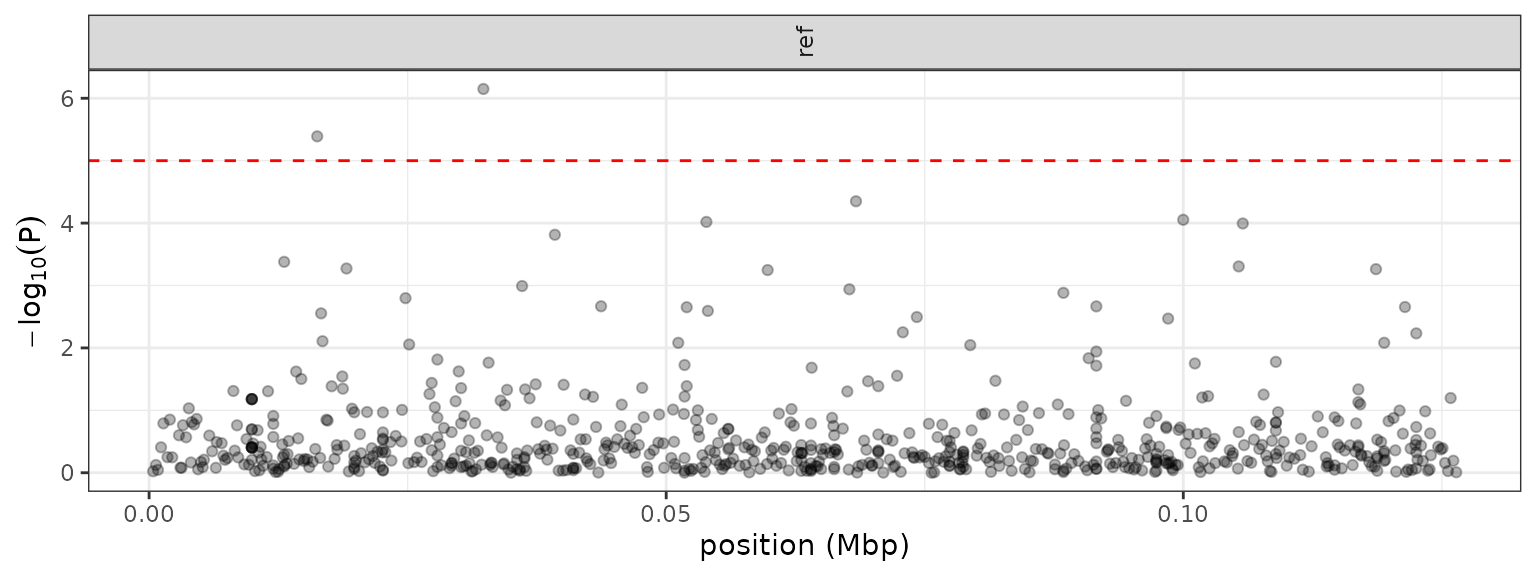
Manhattan plot
Top-associated variants
| ref |
32325 |
>629 |
<632 |
1,1 |
0.0000007 |
| ref |
16257 |
>310 |
<313 |
1,1 |
0.0000041 |
| ref |
68351 |
>1271 |
<1274 |
1,1 |
0.0000447 |
| ref |
99994 |
>1815 |
<1818 |
1,1 |
0.0000884 |
| ref |
53887 |
>1010 |
<1012 |
0,248 |
0.0000957 |
| ref |
105752 |
>1896 |
<1899 |
1,1 |
0.0001014 |
| ref |
39235 |
>765 |
<768 |
1,1 |
0.0001537 |
| ref |
13062 |
>255 |
<266 |
0,602 |
0.0004176 |
| ref |
105360 |
>1888 |
<1893 |
0,571 |
0.0004948 |
| ref |
19088 |
>356 |
<359 |
1,1 |
0.0005337 |
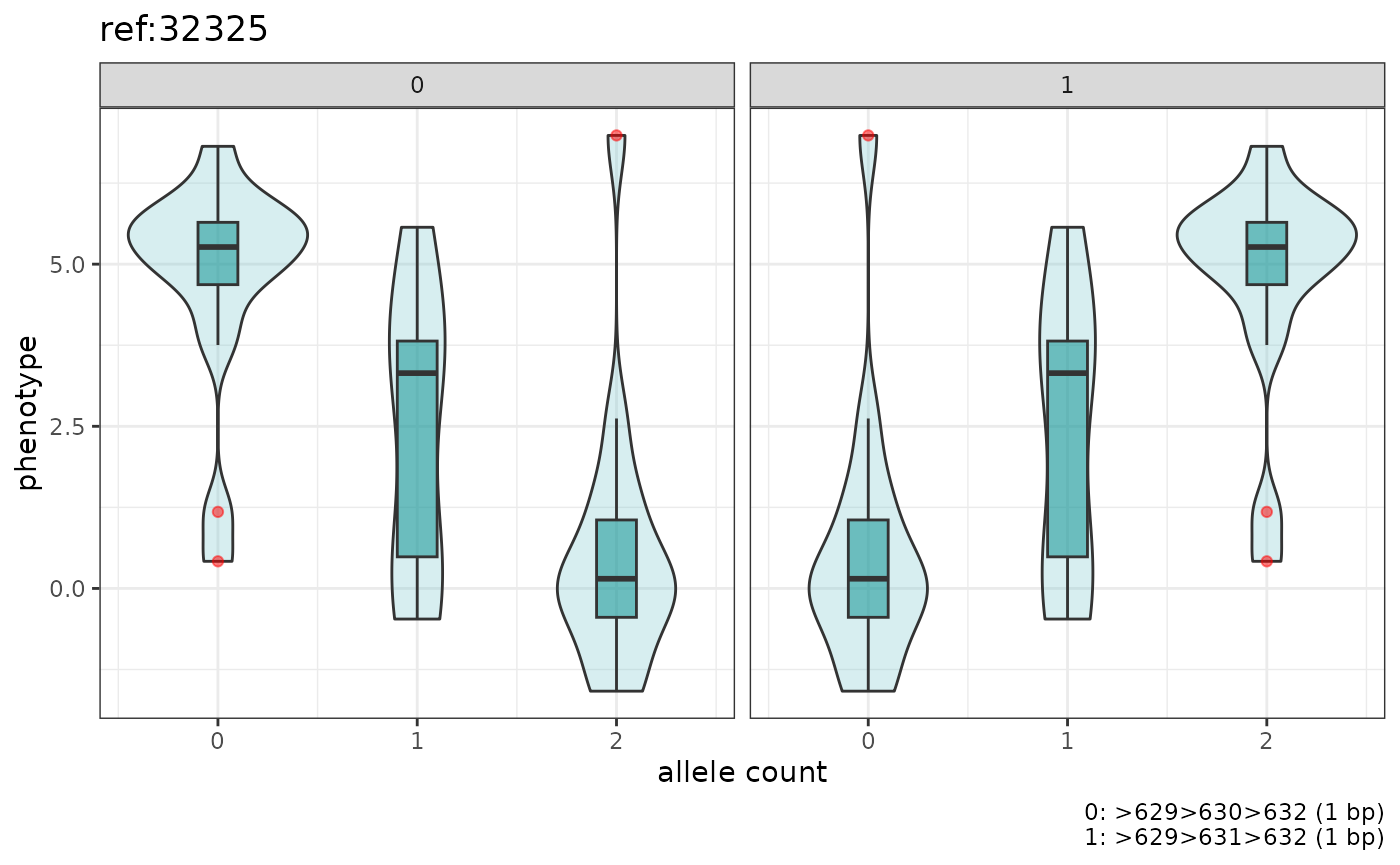
Make a plot for the top association
## prepare file names for the genotypes and phenotype
gt_fn = file.path(test_data_dir, 'snarl_genotypes.sorted.tsv.gz')
pheno_fn = file.path(test_data_dir, 'phenotype.quantitative.tsv')

## get the most associated variant
top.assoc = assoc |> arrange(P) |> head(1)

## boxplot with samples grouped by genotype
genotype_boxplots(gt_fn, pheno_fn, top.assoc)
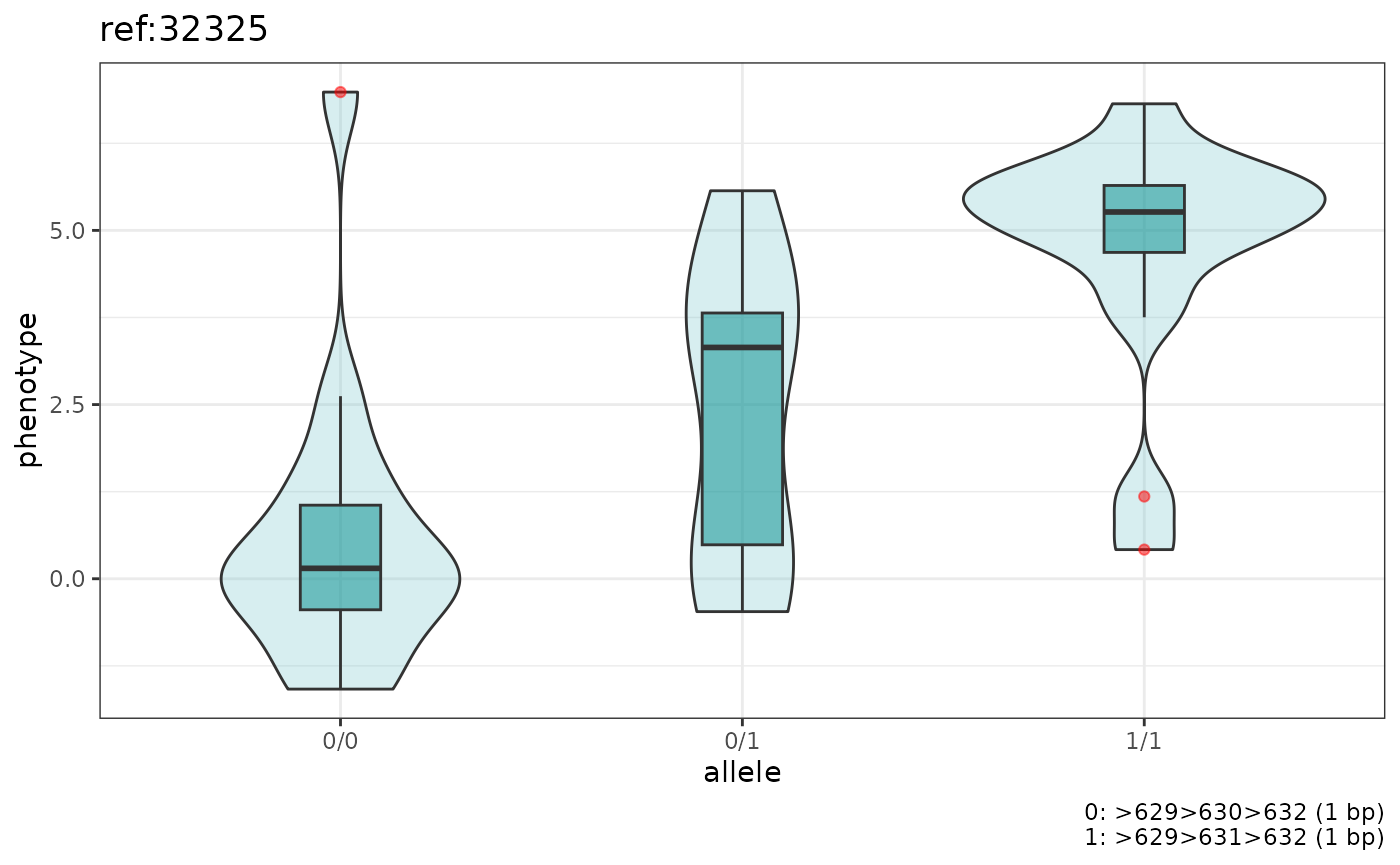
## boxplot with samples grouped by allele
genotype_boxplots(gt_fn, pheno_fn, top.assoc, by_allele=TRUE)
Other graphs
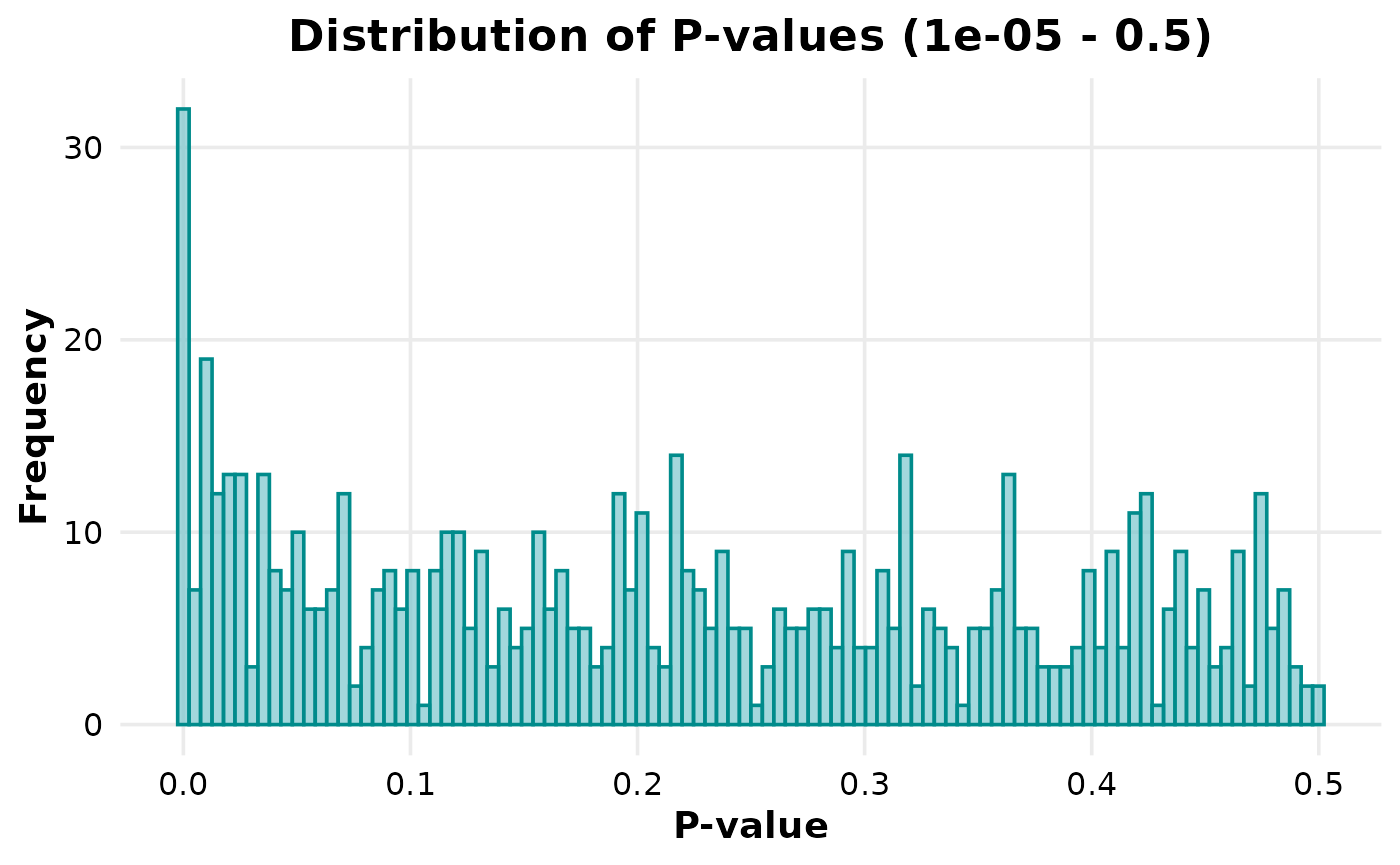
# Histogram of p-values
plot_pvalue_hist(
  file.path(test_data_dir, "gwas", "binary.assoc.chi2.tsv"),
  p_column="P_CHI2",
  min = 0.00001,
  max = 0.5
)
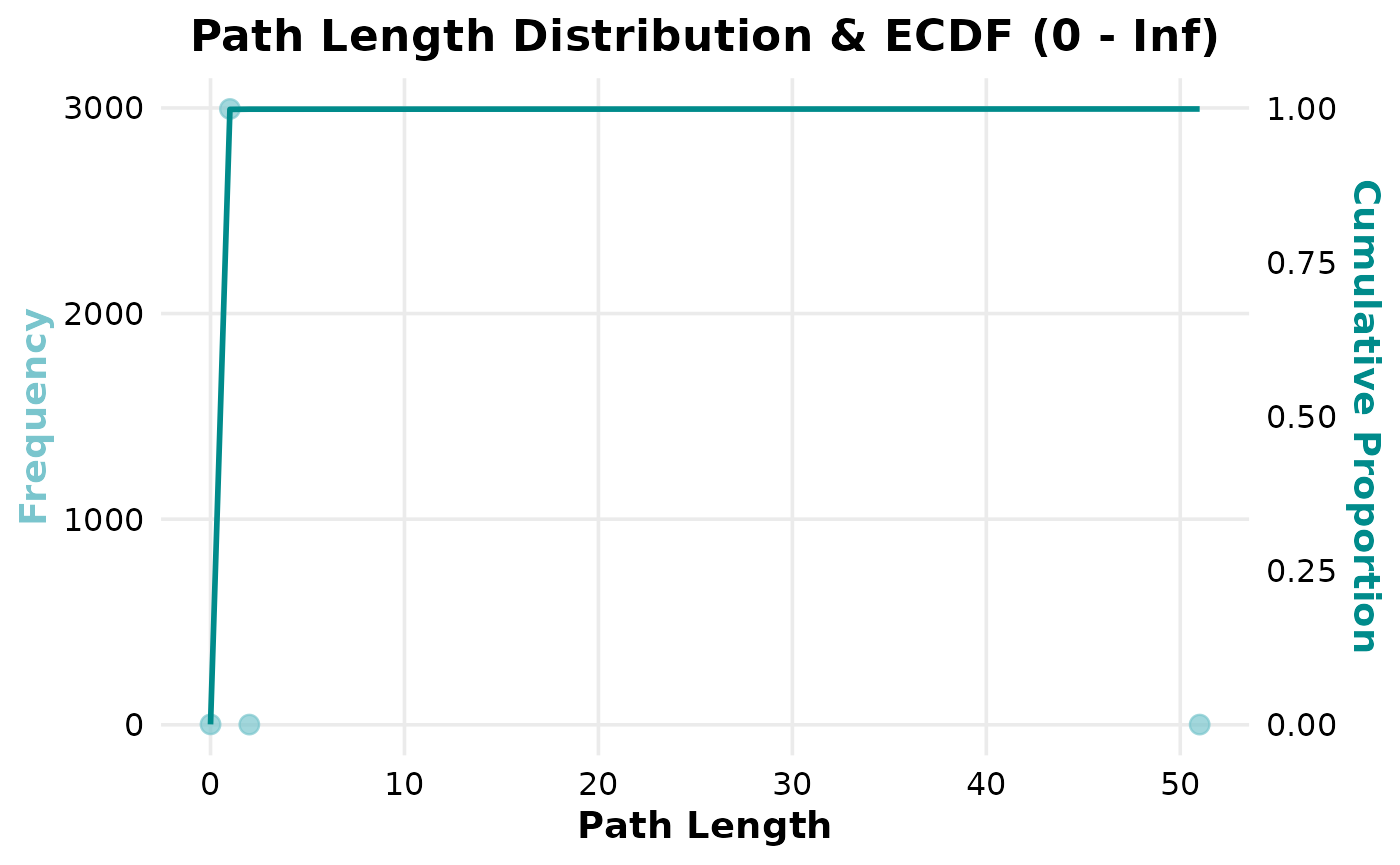
# Dot plot of Path Length Frequencies
path_length_distribution(file.path(test_data_dir, "snarl_paths", "binary.snarl.tsv"))
#> Warning: Use of `freq_df$Path_Length` is discouraged.
#> ℹ Use `Path_Length` instead.
#> Warning: Use of `freq_df$Frequency` is discouraged.
#> ℹ Use `Frequency` instead.
#> Warning: Use of `ecdf_df$Cumulative_scaled` is discouraged.
#> ℹ Use `Cumulative_scaled` instead.
# Snarl type histogram
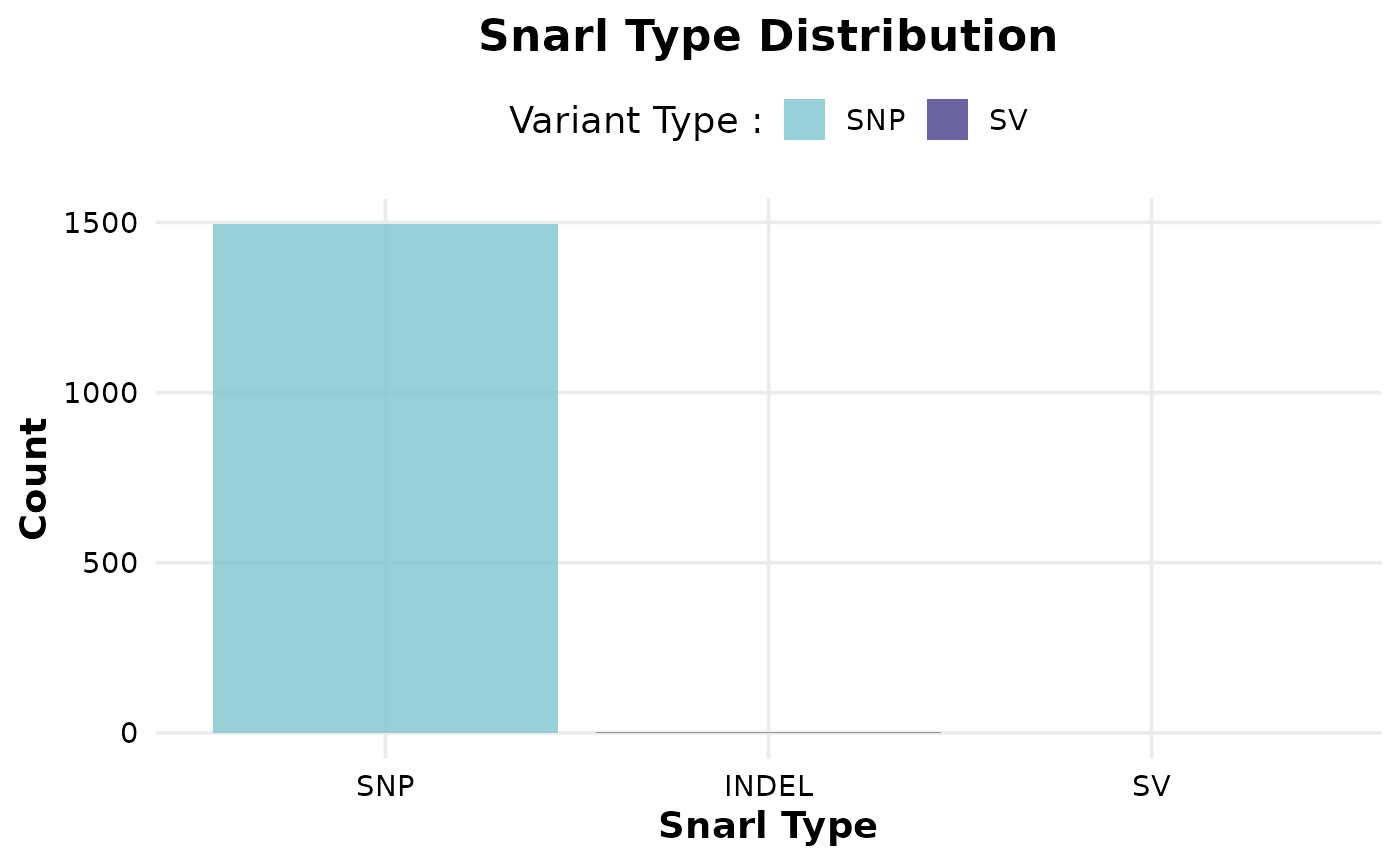
snarl_type_histogram(file.path(test_data_dir, "snarl_paths", "binary.snarl.tsv"))
#>   Variant_Type Count
#> 1        INDEL     3
#> 2          SNP  1495
#> 3           SV     1