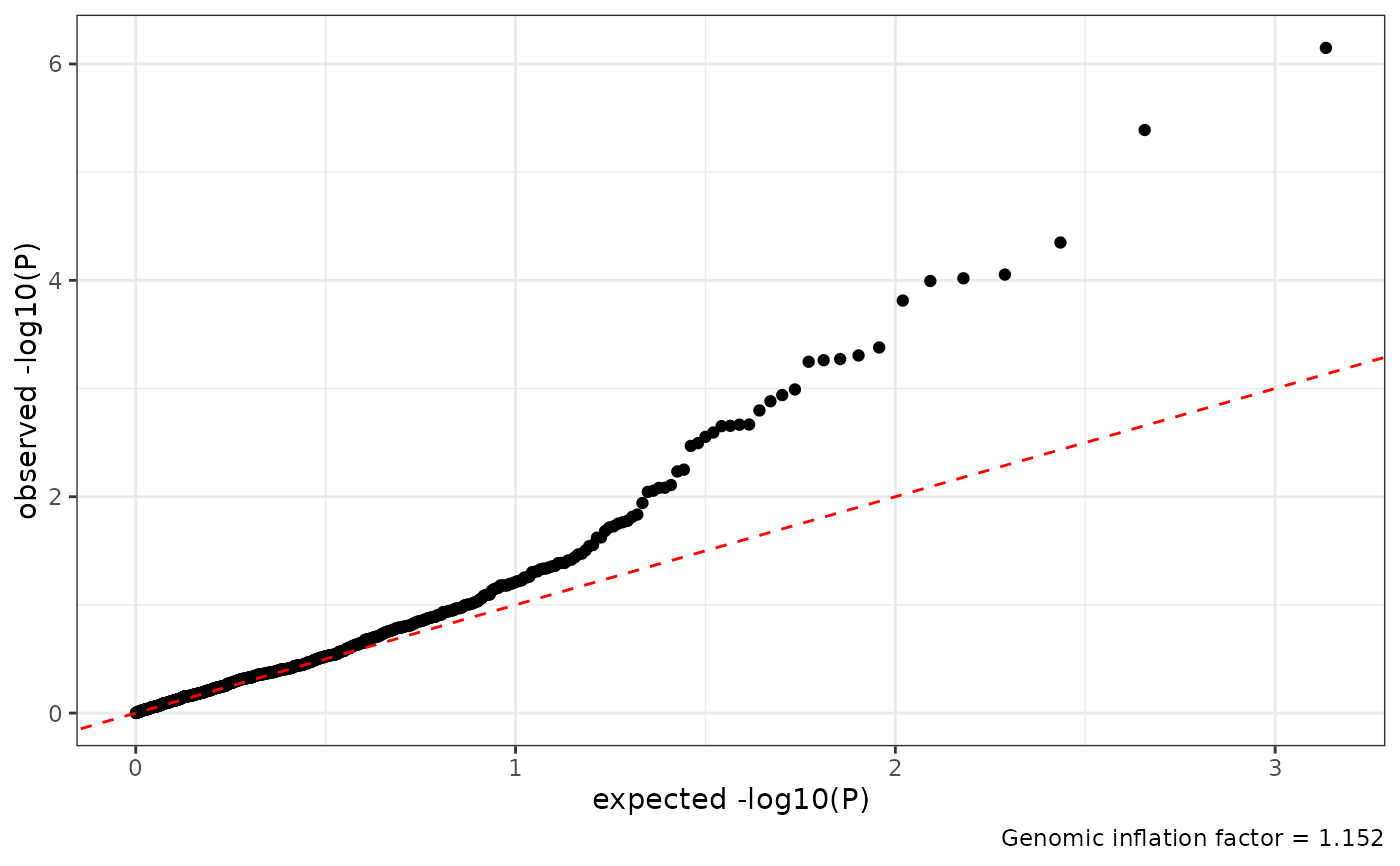
Generate QQ plot of the observed vs expected pvalues
Usage
qq_plot(assoc, output_file = NULL)
Arguments
- assoc
Either the data.frame imported by *import_assoc*, or the path to STOAT's output (*assoc.pvalues.tsv.gz)
- output_file
If not NULL, the name of the output image where to save the plot (image type guessed from the file name).
Value
a ggplot object. Saves a file too if output_file is provided.
Examples
# prepare the filename
assoc_file = system.file('extdata/stoat.quantitative.assoc.pvalues.tsv.gz', package='StoatPlot')

# make the QQ-plot
qq_plot(assoc_file)